Currently Empty: EGP0.00
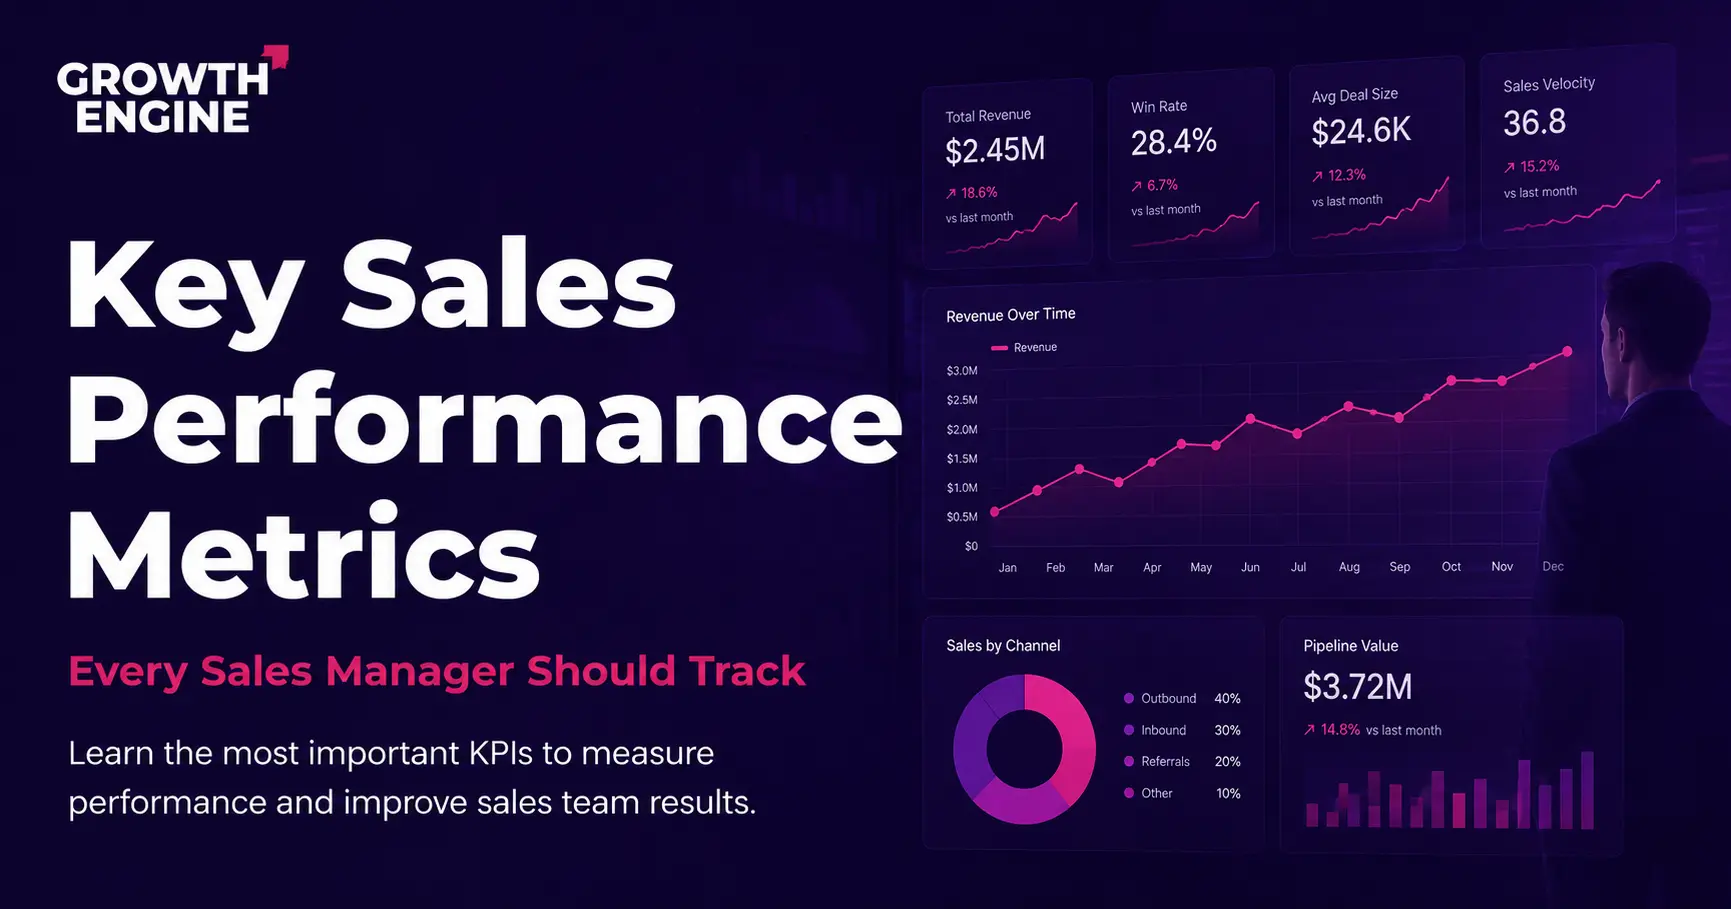
Measuring sales success goes far beyond looking at monthly revenue. A sales team may exceed its revenue target one month while quietly struggling with declining lead quality, longer sales cycles, or falling conversion rates. On the other hand, another team may generate modest revenue today while building a healthier sales pipeline that supports sustainable growth in the future.
This is why successful organizations rely on sales performance KPIs instead of judging performance based on revenue alone. The right metrics allow sales managers to understand what is happening throughout the entire sales process, identify bottlenecks before they affect results, and make confident decisions backed by data rather than assumptions.
At Growth Engine, we believe that improving sales performance starts with measuring the right activities. Every KPI tells part of the story, but together they provide a complete picture of your team’s strengths, weaknesses, and opportunities for improvement.
In this guide, you’ll learn the most important sales KPIs every sales manager should monitor, understand the difference between leading and lagging indicators, and discover how to use data to improve sales team performance, increase forecasting accuracy, and build a scalable sales operation.
Why Revenue Alone Isn’t Enough
Revenue is one of the most important business metrics, but it should never be the only metric used to evaluate a sales team.
A strong revenue month could be driven by one large enterprise deal rather than consistent sales performance. Likewise, revenue growth may hide problems such as declining conversion rates, poor lead qualification, or an unhealthy pipeline.
Tracking multiple sales performance KPIs helps answer critical business questions such as:
- Is the sales team consistently achieving targets?
- Are qualified opportunities increasing?
- Is the sales cycle becoming shorter?
- Are close rates improving?
- Are daily sales activities producing meaningful results?
These insights allow managers to improve processes before performance begins to decline.
Leading vs. Lagging Sales KPIs
One of the most common mistakes sales managers make is focusing only on outcomes instead of measuring the activities that create those outcomes.
Sales KPIs generally fall into two categories.
Lagging Indicators
Lagging indicators measure completed results, including:
- Revenue
- Closed deals
- Sales quota attainment
- Profit
These metrics tell you what has already happened.
However, they don’t explain why it happened.
Leading Indicators
Leading indicators measure the daily activities that influence future results, such as:
- Sales meetings booked
- Qualified leads generated
- Response time
- Proposals sent
- Customer follow-up activities
Because these metrics change before revenue does, they give managers the opportunity to improve performance before business results are affected.
For example, if the number of discovery meetings decreases this month, lower revenue is likely to follow several weeks later unless corrective action is taken.
The Most Important Sales Performance KPIs
1. Sales Quota Attainment
Sales quota attainment measures how successfully an individual salesperson—or an entire team—achieves assigned sales targets.
While this is one of the most commonly tracked KPIs, it shouldn’t be analyzed in isolation.
Managers should compare quota attainment with conversion rates, pipeline quality, and sales activity to understand why targets are—or aren’t—being achieved.
2. Conversion Rate
Conversion rate measures the percentage of prospective customers who become paying customers.
A healthy conversion rate typically indicates that the team is:
- Qualifying leads effectively.
- Managing objections professionally.
- Using strong consultative selling techniques.
- Focusing on high-quality opportunities.
If conversion rates decline, the problem may lie in lead quality, sales skills, or the qualification process.
3. Win Rate
Win rate measures the percentage of qualified opportunities that become closed deals.
Unlike simply counting total sales, this KPI reveals how effectively salespeople capitalize on available opportunities.
For example, winning 25 deals out of 100 qualified opportunities results in a 25% win rate.
Comparing win rates across sales representatives also helps managers identify coaching opportunities and best practices.
4. Sales Velocity
Sales velocity is one of the most valuable—but often overlooked—sales KPIs.
It measures how quickly opportunities generate revenue by combining several metrics:
- Number of opportunities
- Average deal size
- Win rate
- Sales cycle length
The faster opportunities move through the pipeline, the more revenue the business can generate without increasing resources.
5. Average Deal Size
Growing revenue isn’t only about closing more deals.
Increasing the value of each deal can significantly improve overall sales performance.
Tracking average deal size helps sales managers evaluate how effectively representatives:
- Upsell premium solutions.
- Cross-sell complementary products.
- Position higher-value offerings.
Improving this KPI often has a direct impact on profitability.
6. Pipeline Coverage Ratio
Pipeline Coverage Ratio helps sales managers determine whether the current sales pipeline contains enough qualified opportunities to achieve future revenue targets.
It compares the total value of open opportunities against the team’s sales goal.
For example, if the monthly revenue target is $500,000 but the pipeline contains only $700,000 in opportunities, the business may struggle to hit its goal—especially if the average win rate is below 30%.
High-performing organizations typically maintain a healthy pipeline that is several times larger than their sales target, allowing for lost opportunities while still achieving consistent growth.
Monitoring this KPI enables sales managers to identify pipeline shortages before they negatively impact revenue.
7. Sales Forecast Accuracy
Accurate sales forecasting is one of the most important responsibilities of every sales manager.
Business leaders rely on sales forecasts to make decisions about hiring, budgeting, inventory, marketing investments, and overall business planning.
Rather than relying on intuition alone, forecasts should be based on historical data and measurable sales performance KPIs.
Consistently accurate forecasts indicate that opportunities are being qualified correctly and that the sales pipeline reflects reality.
Large forecasting gaps often reveal problems in pipeline management, opportunity qualification, or deal stage definitions.
8. Average Lead Response Time
Speed has become a major competitive advantage in modern sales.
Prospects who receive a quick response are significantly more likely to engage in meaningful conversations than those who wait hours—or even days—for a reply.
That’s why sales managers should closely monitor how quickly their teams respond to new inquiries.
Reducing response time improves customer experience, increases engagement, and creates more opportunities before competitors have a chance to respond.
9. Lead Qualification Rate
Not every lead deserves the same amount of attention.
Lead Qualification Rate measures the percentage of incoming leads that meet your company’s ideal customer profile and are ready to enter the sales pipeline.
A high qualification rate usually indicates strong alignment between sales and marketing.
A low qualification rate may suggest problems with lead generation campaigns, targeting, or qualification criteria.
Improving this KPI allows sales representatives to spend more time selling and less time pursuing low-quality opportunities.
Turning KPIs into Better Sales Performance
Tracking numbers alone won’t improve sales performance.
The real value comes from using data to make better decisions.
For example:
- A declining conversion rate may indicate the need for additional sales coaching.
- Longer sales cycles could reveal bottlenecks in the buying process.
- Falling win rates might suggest stronger competition or ineffective objection handling.
- Poor response times may require workflow improvements or automation.
Successful sales leaders transform performance data into actionable improvement plans.
Professionals looking to build a complete KPI-driven sales management system can benefit from Growth Engine’s Sales Management Mastery program, which teaches practical frameworks for performance measurement, pipeline optimization, and data-driven decision-making.
Build a Sales Dashboard That Drives Better Decisions
Many organizations generate dozens of reports every month but still struggle to understand overall sales performance.
A well-designed sales dashboard should provide a real-time overview of the metrics that matter most.
An effective dashboard typically includes:
- Revenue versus target.
- Conversion rate.
- Win rate.
- New qualified opportunities.
- Pipeline value.
- Average sales cycle.
- Average deal size.
- Forecast accuracy.
- Individual sales representative performance.
Reviewing these KPIs weekly enables managers to identify trends early and respond before small issues become major problems.
Common Mistakes When Measuring Sales KPIs
Even companies with sophisticated reporting systems often fail to use their KPIs effectively.
Tracking Too Many Metrics
Measuring everything often leads to measuring nothing.
Instead of monitoring dozens of statistics, focus on the KPIs that directly support your business objectives.
A smaller number of meaningful metrics produces clearer insights and better decision-making.
Ignoring Leading Indicators
Many businesses focus entirely on revenue while overlooking the daily activities that generate future sales.
Leading indicators provide early warning signs that allow managers to improve performance before financial results begin to decline.
Failing to Act on the Data
Reports alone don’t improve sales performance.
Once performance gaps have been identified, organizations need structured coaching, process improvements, and targeted development initiatives.
That’s why many companies invest in Corporate Sales Training programs that help sales teams strengthen the exact skills highlighted by KPI analysis, leading to higher productivity, improved conversion rates, and stronger revenue growth.
The Sales Manager’s Role in KPI-Driven Leadership
Great sales managers do more than monitor dashboards.
They use data to coach their teams, prioritize opportunities, improve processes, and build a culture of continuous improvement.
Regular KPI reviews should become part of every sales team’s routine, helping representatives understand how daily activities influence long-term business outcomes.
Managers who want to strengthen their leadership skills can also explore How to Manage a Sales Team and Improve Performance, where practical strategies for coaching, accountability, and performance optimization are covered in greater depth.
Conclusion
Tracking the right sales performance KPIs enables organizations to move beyond guesswork and make smarter, data-driven decisions. By monitoring both leading and lagging indicators, sales managers gain a complete understanding of team performance, pipeline health, forecasting accuracy, and revenue opportunities.
At Growth Engine, we believe that successful sales management starts with measuring what truly matters. Our practical sales training programs help sales leaders build high-performing teams, develop KPI-driven sales strategies, and create scalable systems that consistently improve productivity, increase conversion rates, and drive sustainable business growth.
Frequently Asked Questions
What are sales performance KPIs?
Sales performance KPIs are measurable metrics used to evaluate the effectiveness of sales activities, team productivity, and overall sales results. They help organizations make informed decisions based on data rather than assumptions.
Why are sales KPIs important?
Sales KPIs provide visibility into every stage of the sales process, helping managers identify strengths, uncover performance gaps, and improve overall sales efficiency.
What’s the difference between leading and lagging KPIs?
Leading KPIs measure activities that influence future sales, such as meetings and response times, while lagging KPIs measure completed outcomes like revenue and closed deals.
Which sales KPI is the most important?
There isn’t a single most important KPI. High-performing sales organizations monitor a combination of conversion rate, win rate, sales velocity, pipeline coverage, and revenue to gain a complete performance picture.
How often should sales KPIs be reviewed?
Most operational KPIs should be reviewed weekly, while strategic performance metrics are typically analyzed monthly or quarterly depending on business objectives.
What is Sales Velocity?
Sales Velocity measures how quickly opportunities generate revenue by combining opportunity volume, average deal size, win rate, and sales cycle length.
How can I improve my sales KPIs?
Improving sales KPIs requires better lead qualification, stronger sales coaching, optimized sales processes, consistent follow-up, and continuous performance analysis.
What should a sales dashboard include?
A sales dashboard should include revenue, quota attainment, conversion rate, pipeline value, win rate, average deal size, sales cycle length, and forecast accuracy.
Why is forecast accuracy important?
Accurate forecasts support better financial planning, resource allocation, hiring decisions, and business growth strategies.
Can small businesses benefit from tracking sales KPIs?
Absolutely. Even small sales teams can improve productivity, identify growth opportunities, and make better decisions by consistently tracking a focused set of meaningful sales KPIs.